- Details
- Category: datasets
Probability Map of Distributed Faulting in Italy
PDF-Italy 1.0 is a national-scale conditional probabilistic map of distributed faulting. This work builds upon and extends a previous DPC-funded initiative on DISS–ITHACA interoperability (published on: https://diss.ingv.it/ithdiss/), enhancing the joint use of the two datasets within a unified hazard framework. PDF-Italy includes two products: 1) a continuous map of distributed faulting likelihood across Italy, produced by aggregating conditional probabilities over a regular grid, and 2) an application to the ITHACA faults, providing probability estimates directly on the mapped structures.
Surface faulting induced by moderate-to-large earthquakes (Mw ≥5.5) may represent a significant hazard for infrastructures, as coseismic slip may propagate to the surface and activate both primary and secondary structures, producing distributed faulting, consisting of secondary ruptures and deformation affecting wide areas around the main fault.
The maps provided by PDF-Italy offer a quantitative representation of the spatial distribution of distributed faulting probabilities across Italy and on the mapped ITHACA faults. The probabilities shown are conditional probabilities, expressing the likelihood of distributed faulting associated with a moderate-to-large earthquake (Mw ≥ 5.5) occurring on a given source fault. They do not represent the probability that distributed faulting will occur within a specified time interval. Because distributed faulting can only occur if the causative earthquake takes place, the actual absolute probability of observing such phenomena at a given location and within a given period of time is substantially lower than the conditional probabilities displayed in the maps. Probabilities in Panel A of the figure are computed only for locations within 25 km of mapped seismogenic sources; areas farther away are assigned a probability of zero. The color scale in the maps is intended to highlight relative spatial variations in distributed faulting likelihood within earthquake scenarios and should not be interpreted as a measure of time-dependent hazard. Future developments will integrate fault slip rates and earthquake recurrence information to derive time-dependent probabilities.
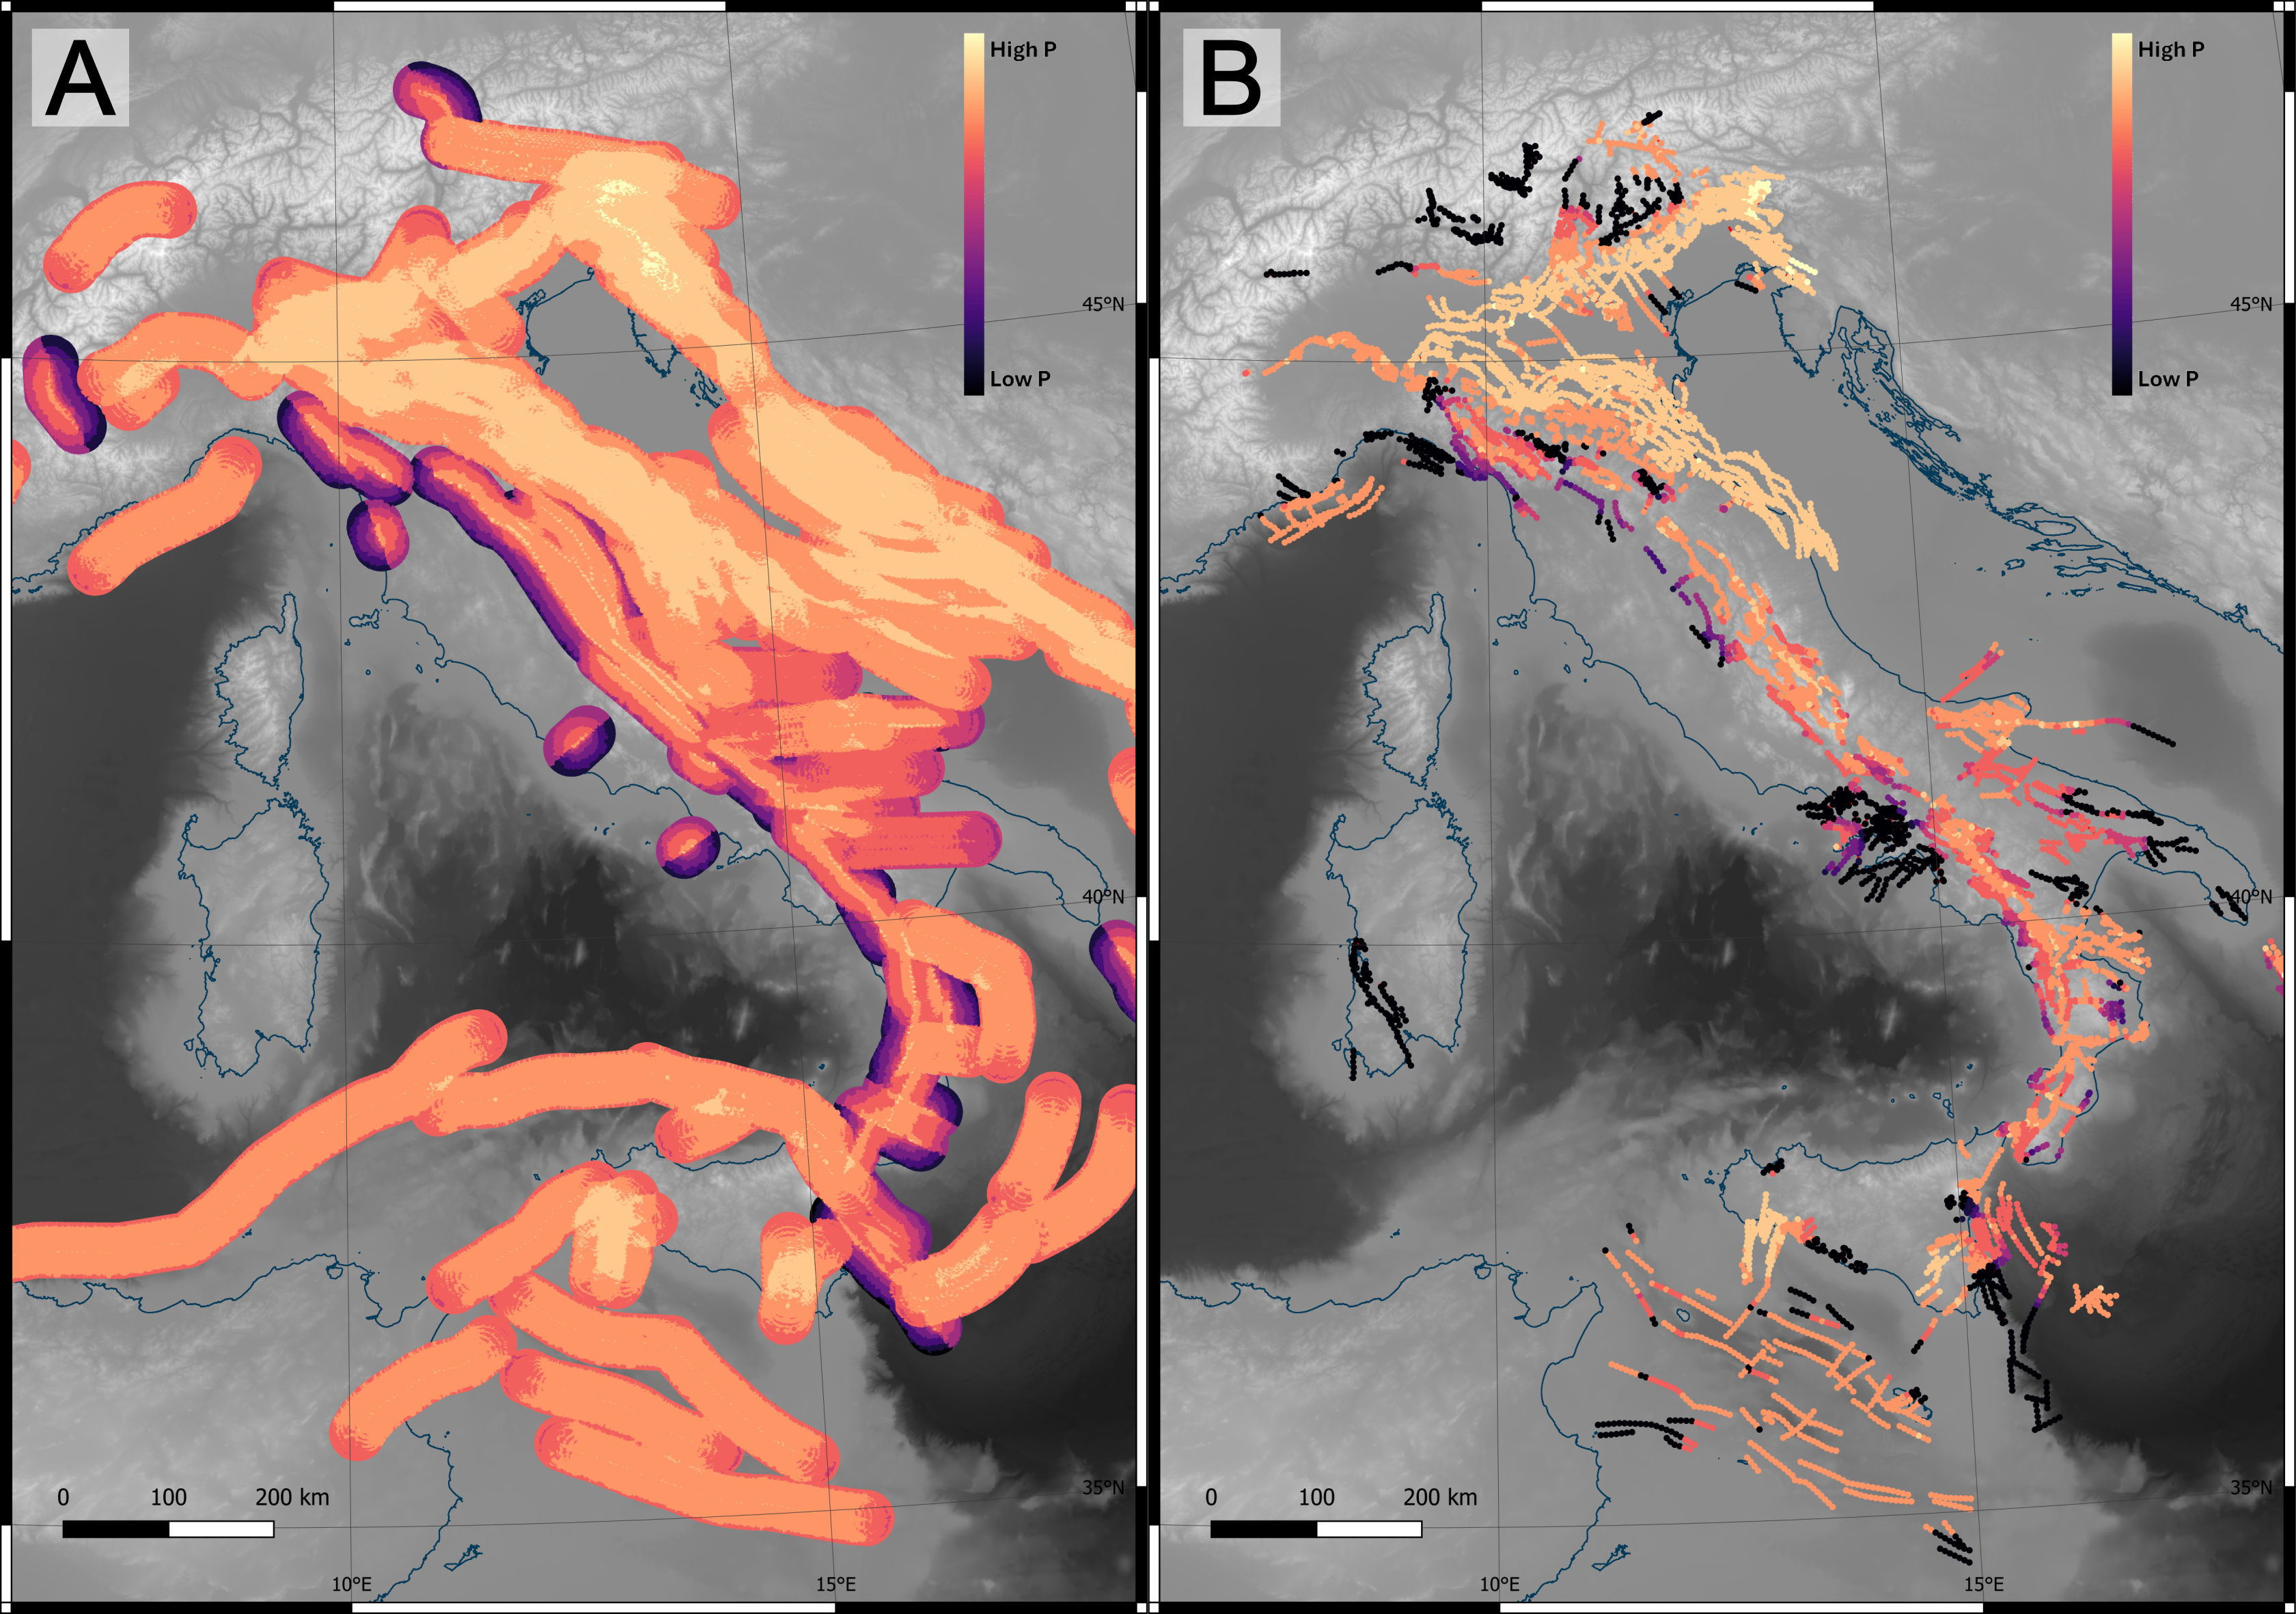
Figure. PDF-Italy products. (A) National-scale map of distributed faulting conditional probabilities associated with moderate-to-large earthquakes (Mw ≥ 5.5), calculated on a regular grid. (B) Conditional probabilities projected onto the mapped fault traces of the ITHACA database. Colors indicate relative variations in conditional probability within the modeled earthquake scenarios and should not be interpreted as time-dependent probabilities of occurrence.
- Details
- Category: datasets
SF3D: Seismogenic Faults in three Dimensions
The Seismogenic Faults in three Dimensions (SF3D) is a compiled pilot dataset consisting of three-dimensional fault-geometry reconstructions natively designed for Earth's crust dimensions.
- Scope and Data: This initial pilot release includes crustal faults across diverse tectonic settings (active margins and stable continental regions) and environments (onshore, offshore, mountain belts, and foredeeps). It encompasses various faulting styles (normal, reverse, and transcurrent) that may slice through the ground surface, remain blind, or be buried beneath thick sedimentary cover. As a pilot study, it is designed as a foundational framework rather than a complete or exhaustive repository for immediate multi-context application.
- Key Features: All faults are modeled as triangular meshes generated via the specialized, custom-developed FaultStudio QGIS plugin. The dataset is distributed across three distinct mapping layers:
- A Master Table outlining the crustal fault mesh boundaries.
- A Meshes Table containing the individual triangular elements of the fault mesh.
- A Points Table archiving the raw input data points utilized to generate the models.
- Scientific & Practical Value:
- Repeatability: By providing the raw Points Table alongside the structured FaultStudio workflow, the dataset ensures that the creation of the Mesh Table can be perfectly reproduced by other researchers.
- Dynamic Updates: A core advantage of SF3D is its ability to perform seamless geometric updates. As fresh data emerges—even a single new data point—the workflow can be quickly rerun to regenerate an updated mesh without losing pre-existing information or requiring new arbitrary geological assumptions.
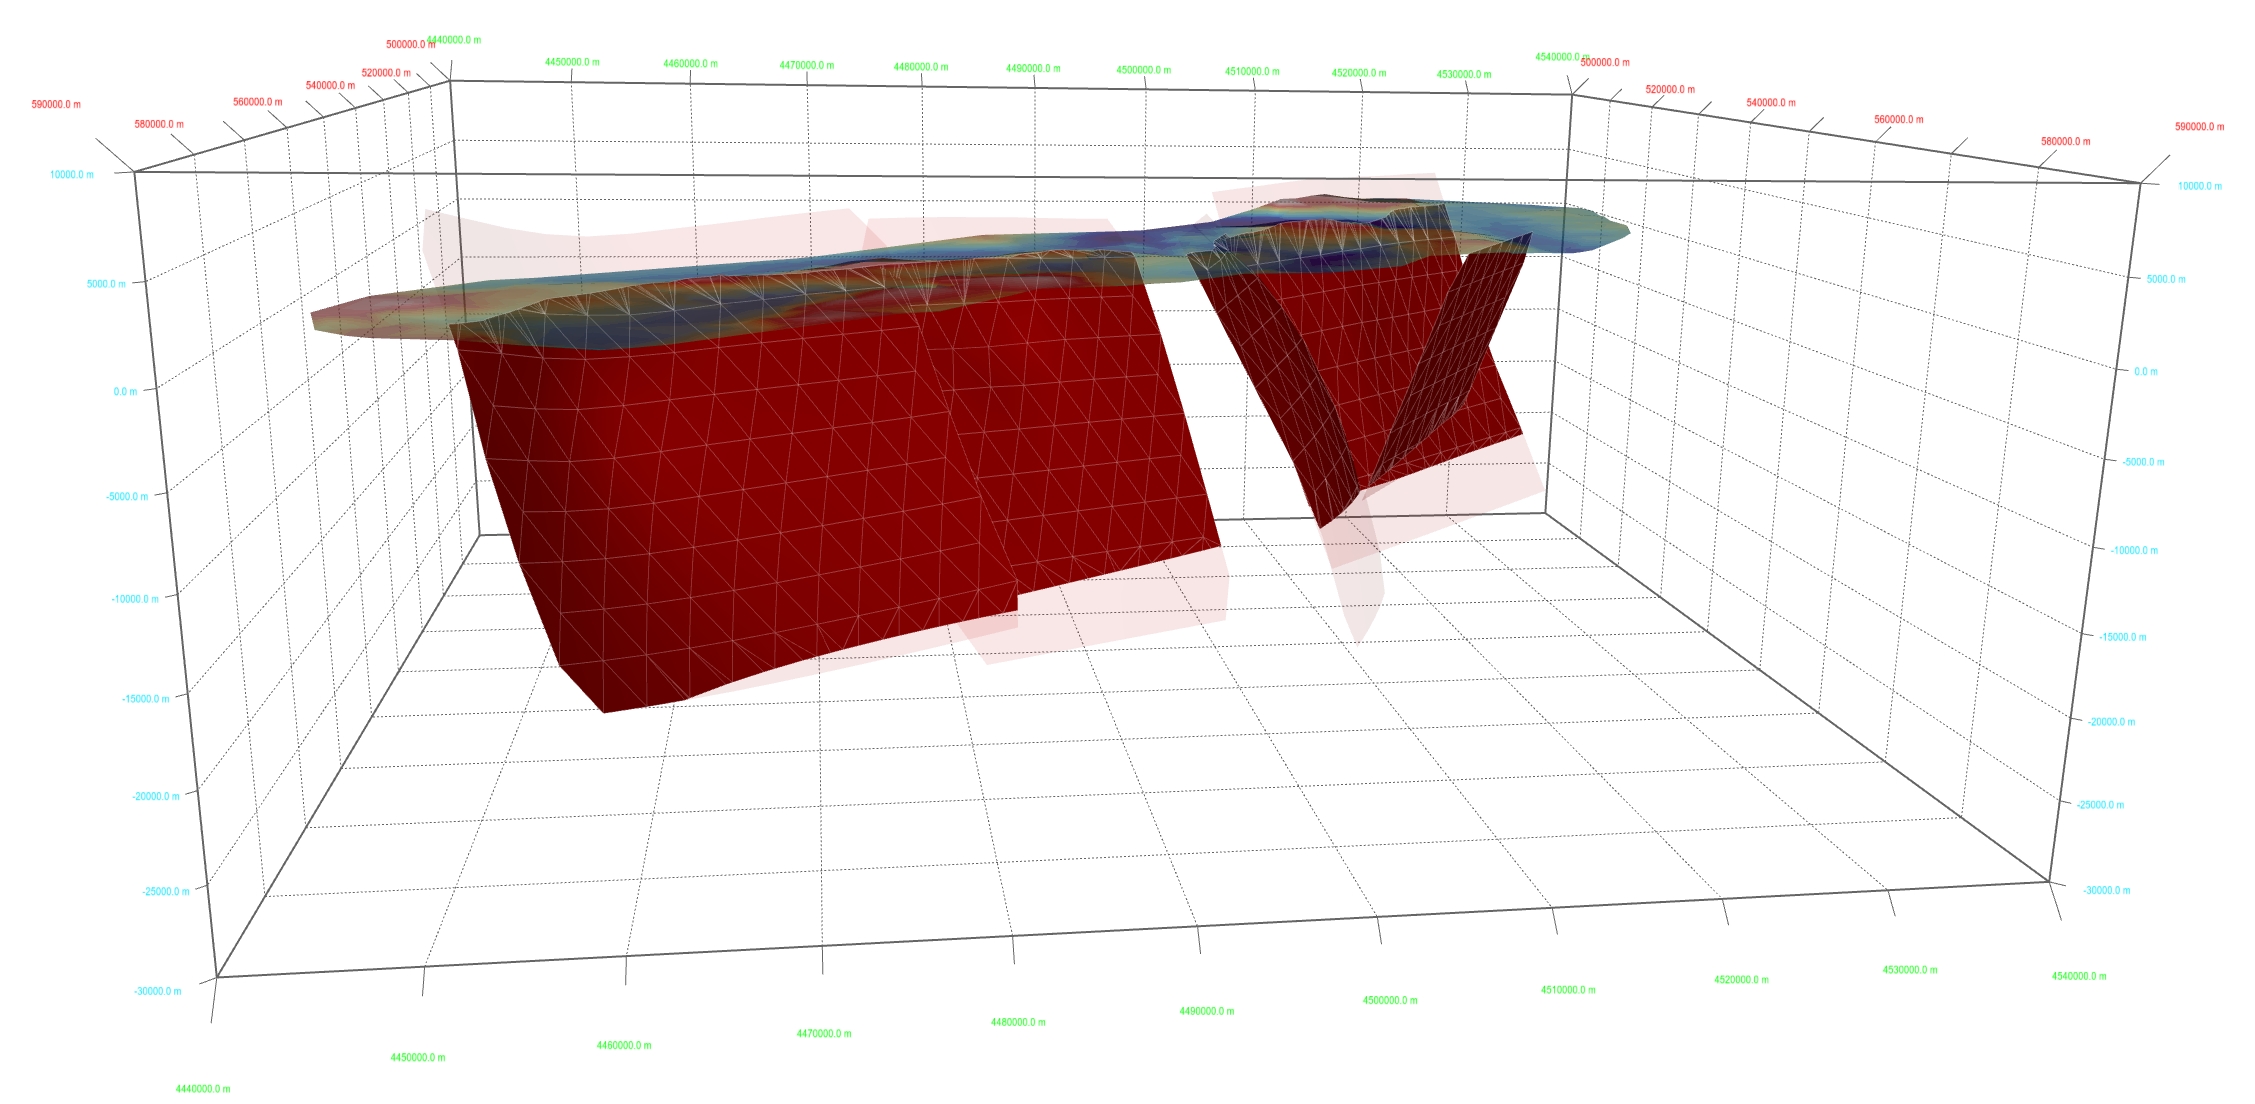
Oblique view of a 3D reconstruction of the Irpinia-Agri Fault System (southern Italy) from the South-East. The three fault segments in the northwestern sector are the source of the 23 November 1980, Mw 6.9, earthquake.
- Details
- Category: datasets
Database of Surface Faulting events in ITaly - SFIT
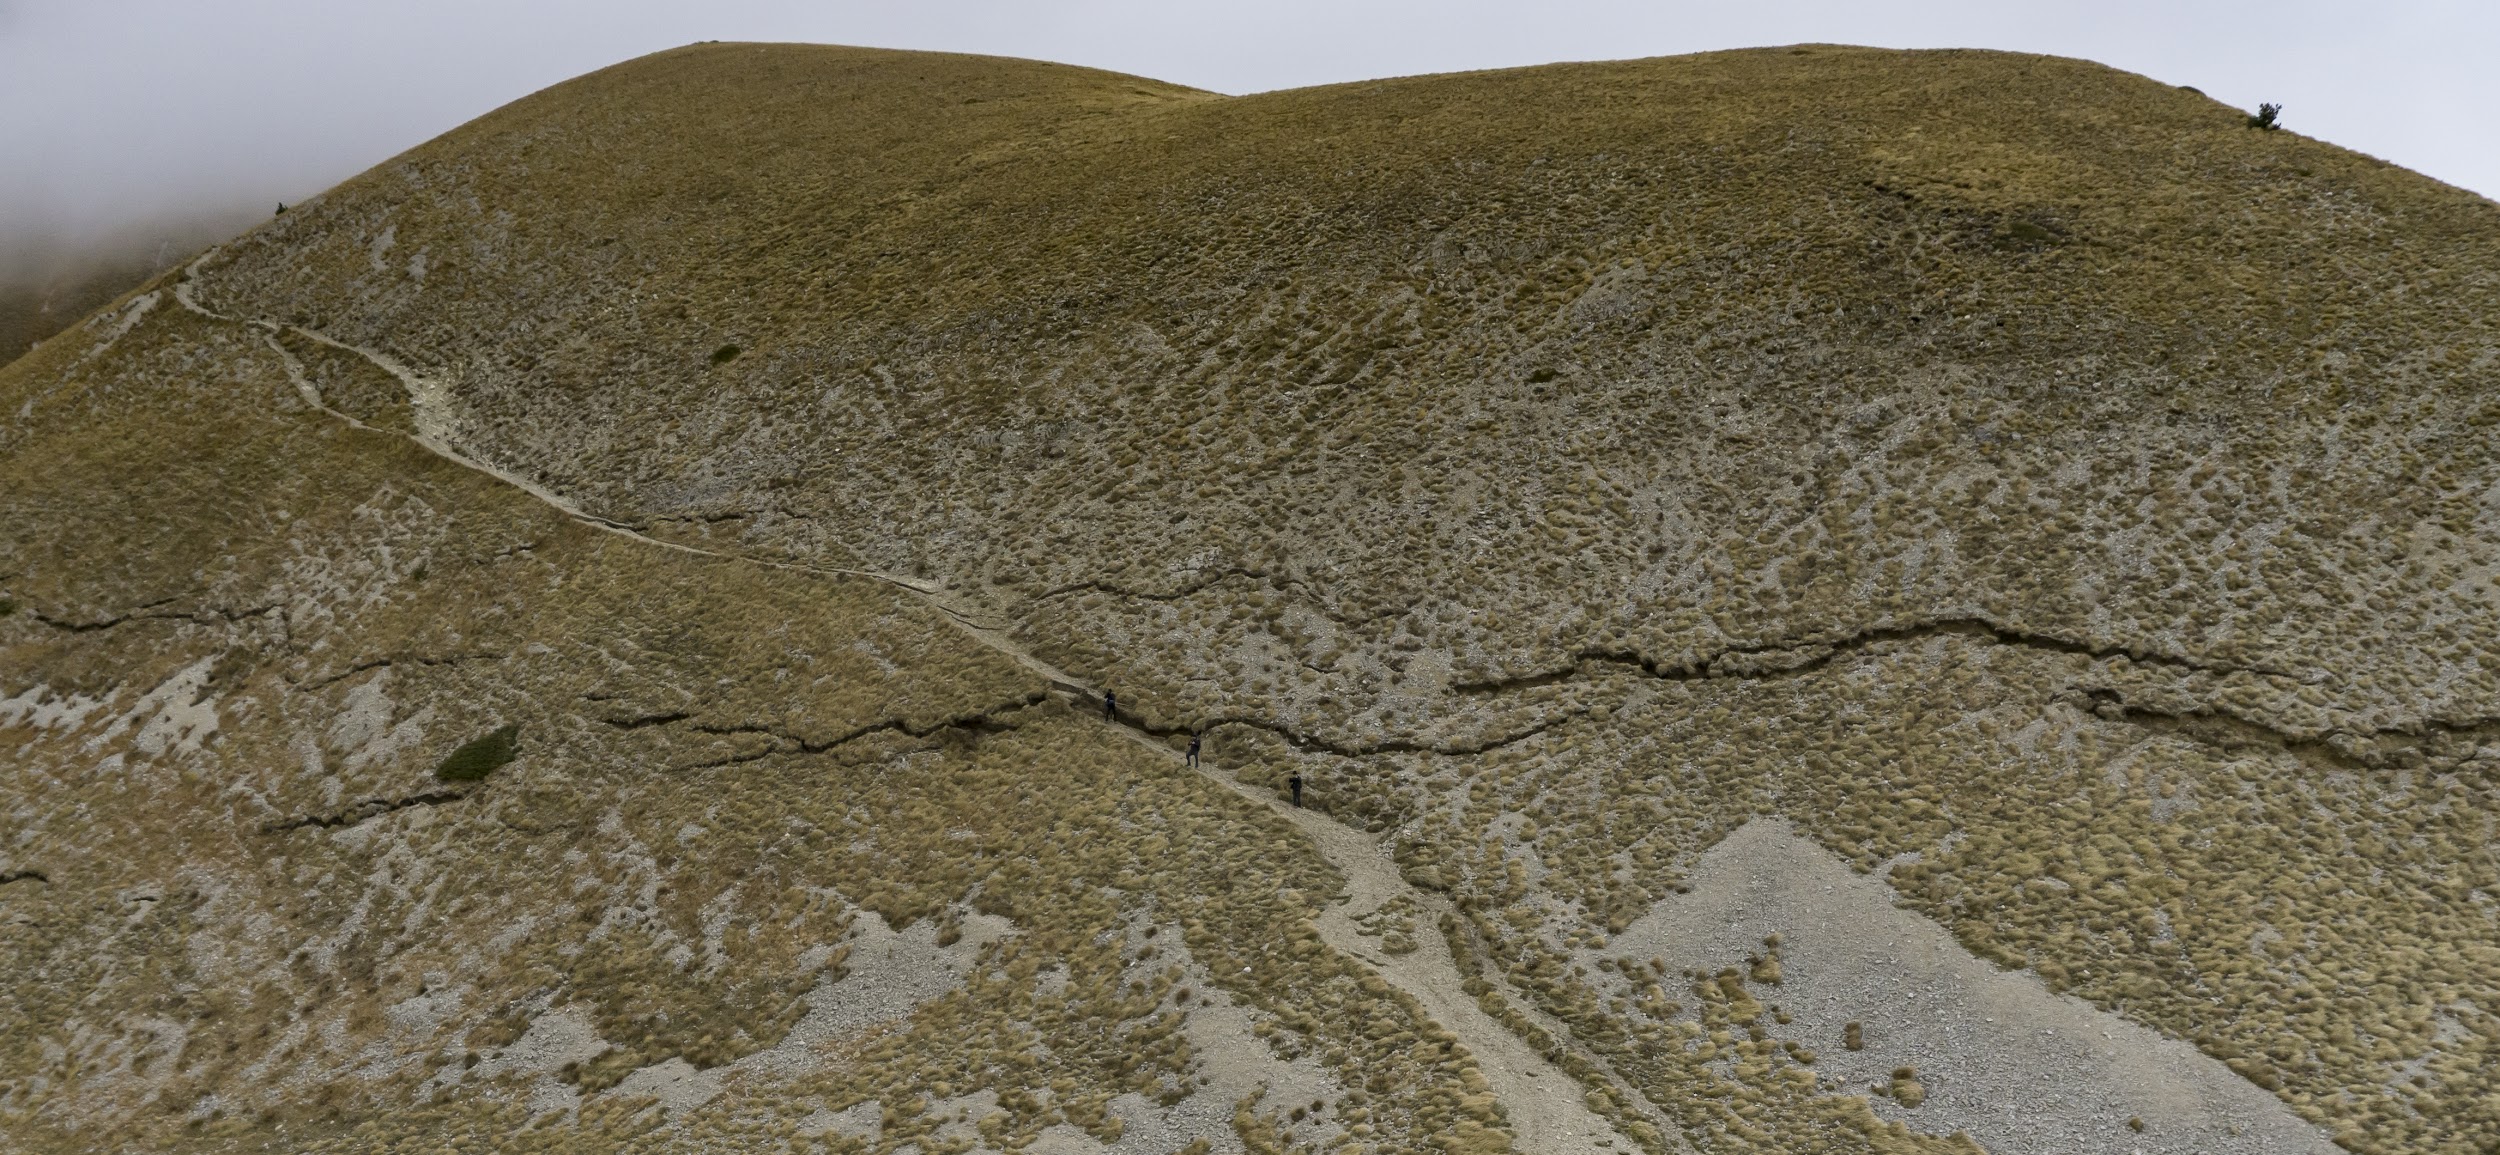
These rupture lines could be followed for a total extent of about 22 km. Credit: INGV.
The database of Surface Faulting events of Italy (SFIT) is a comprehensive compilation of published data on earthquake surface fault ruptures in Italy over the last century. The first release of the database documents six major events: the 1915 Avezzano (M7.0), 1980 Irpinia (M6.9), 1997 Umbria-Marche (M6.0), 2009 L’Aquila (M6.3), 2016 Norcia (M6.6), and 2018 Etna-Fleri (M5.0) earthquakes.
SFIT integrates, organizes, and harmonizes heterogeneous datasets derived from previously published compilations and scientific literature into a unified structure. All data included in the database are derived from previously published data sources. The database spans different tectonic environments and includes earthquakes with different magnitudes, rupture styles, and geological contexts.
Over the past decades, both the quantity and the resolution of available observations have increased significantly. While historical earthquakes inevitably carry greater spatial uncertainty, SFIT applies modern standards of data organization, image documentation, and georeferencing to ensure that these records remain scientifically robust and comparable through time.
SFIT contains a wide range of information on points and traces of surface rupture collected in the field. The primary value of SFIT lies in its ability to centralize several data types within a single, searchable, open-access database. In addition, SFIT provides for the first time a collection of images, primarily photographic documentation, georeferenced and associated with the surface ruptures, representing a precious visual record of the observed deformation. The significance of mapped surface ruptures is classified following the original interpretation in the data source through a ranking code that systematically distinguishes principal ruptures from distributed, triggered, or ground-shaking-induced ruptures.
Principal coseismic surface ruptures represent the direct geomorphic expression of slip occurring along a fault during an earthquake (i.e. surface faulting). Their spatial distribution, geometry, kinematics and size provide a critical proxy for understanding the location, geometry, and kinematic behavior of the causative fault and the surrounding stress field. The systematic collection of coseismic surface rupture data is therefore essential for reconstructing earthquake rupture processes. For historical earthquakes that lack instrumental records, such observations can also be used to estimate earthquake magnitudes and to constrain the location and geometry of the causative fault. At the same time, coseismic fault displacement represents a localized source of hazard associated with surface-rupturing earthquakes, as it can directly affect settlements, infrastructure, and the landscape. By documenting the physical impact of surface faulting on both the natural environment and the built environment, SFIT provides an important resource for seismic hazard assessment and for improving the mitigation of risks associated with future surface-faulting earthquakes. The database can also be a reference for rapid scientific surveys during seismic emergencies, particularly for field teams operating on the ground, such as those involved in the long-standing Emergeo Working Group coordinated by INGV.
SFIT is designed as a living resource and will be progressively updated through new releases that incorporate additional events and datasets, ensuring its long-term value for both the scientific community and stakeholders involved in seismic risk management.
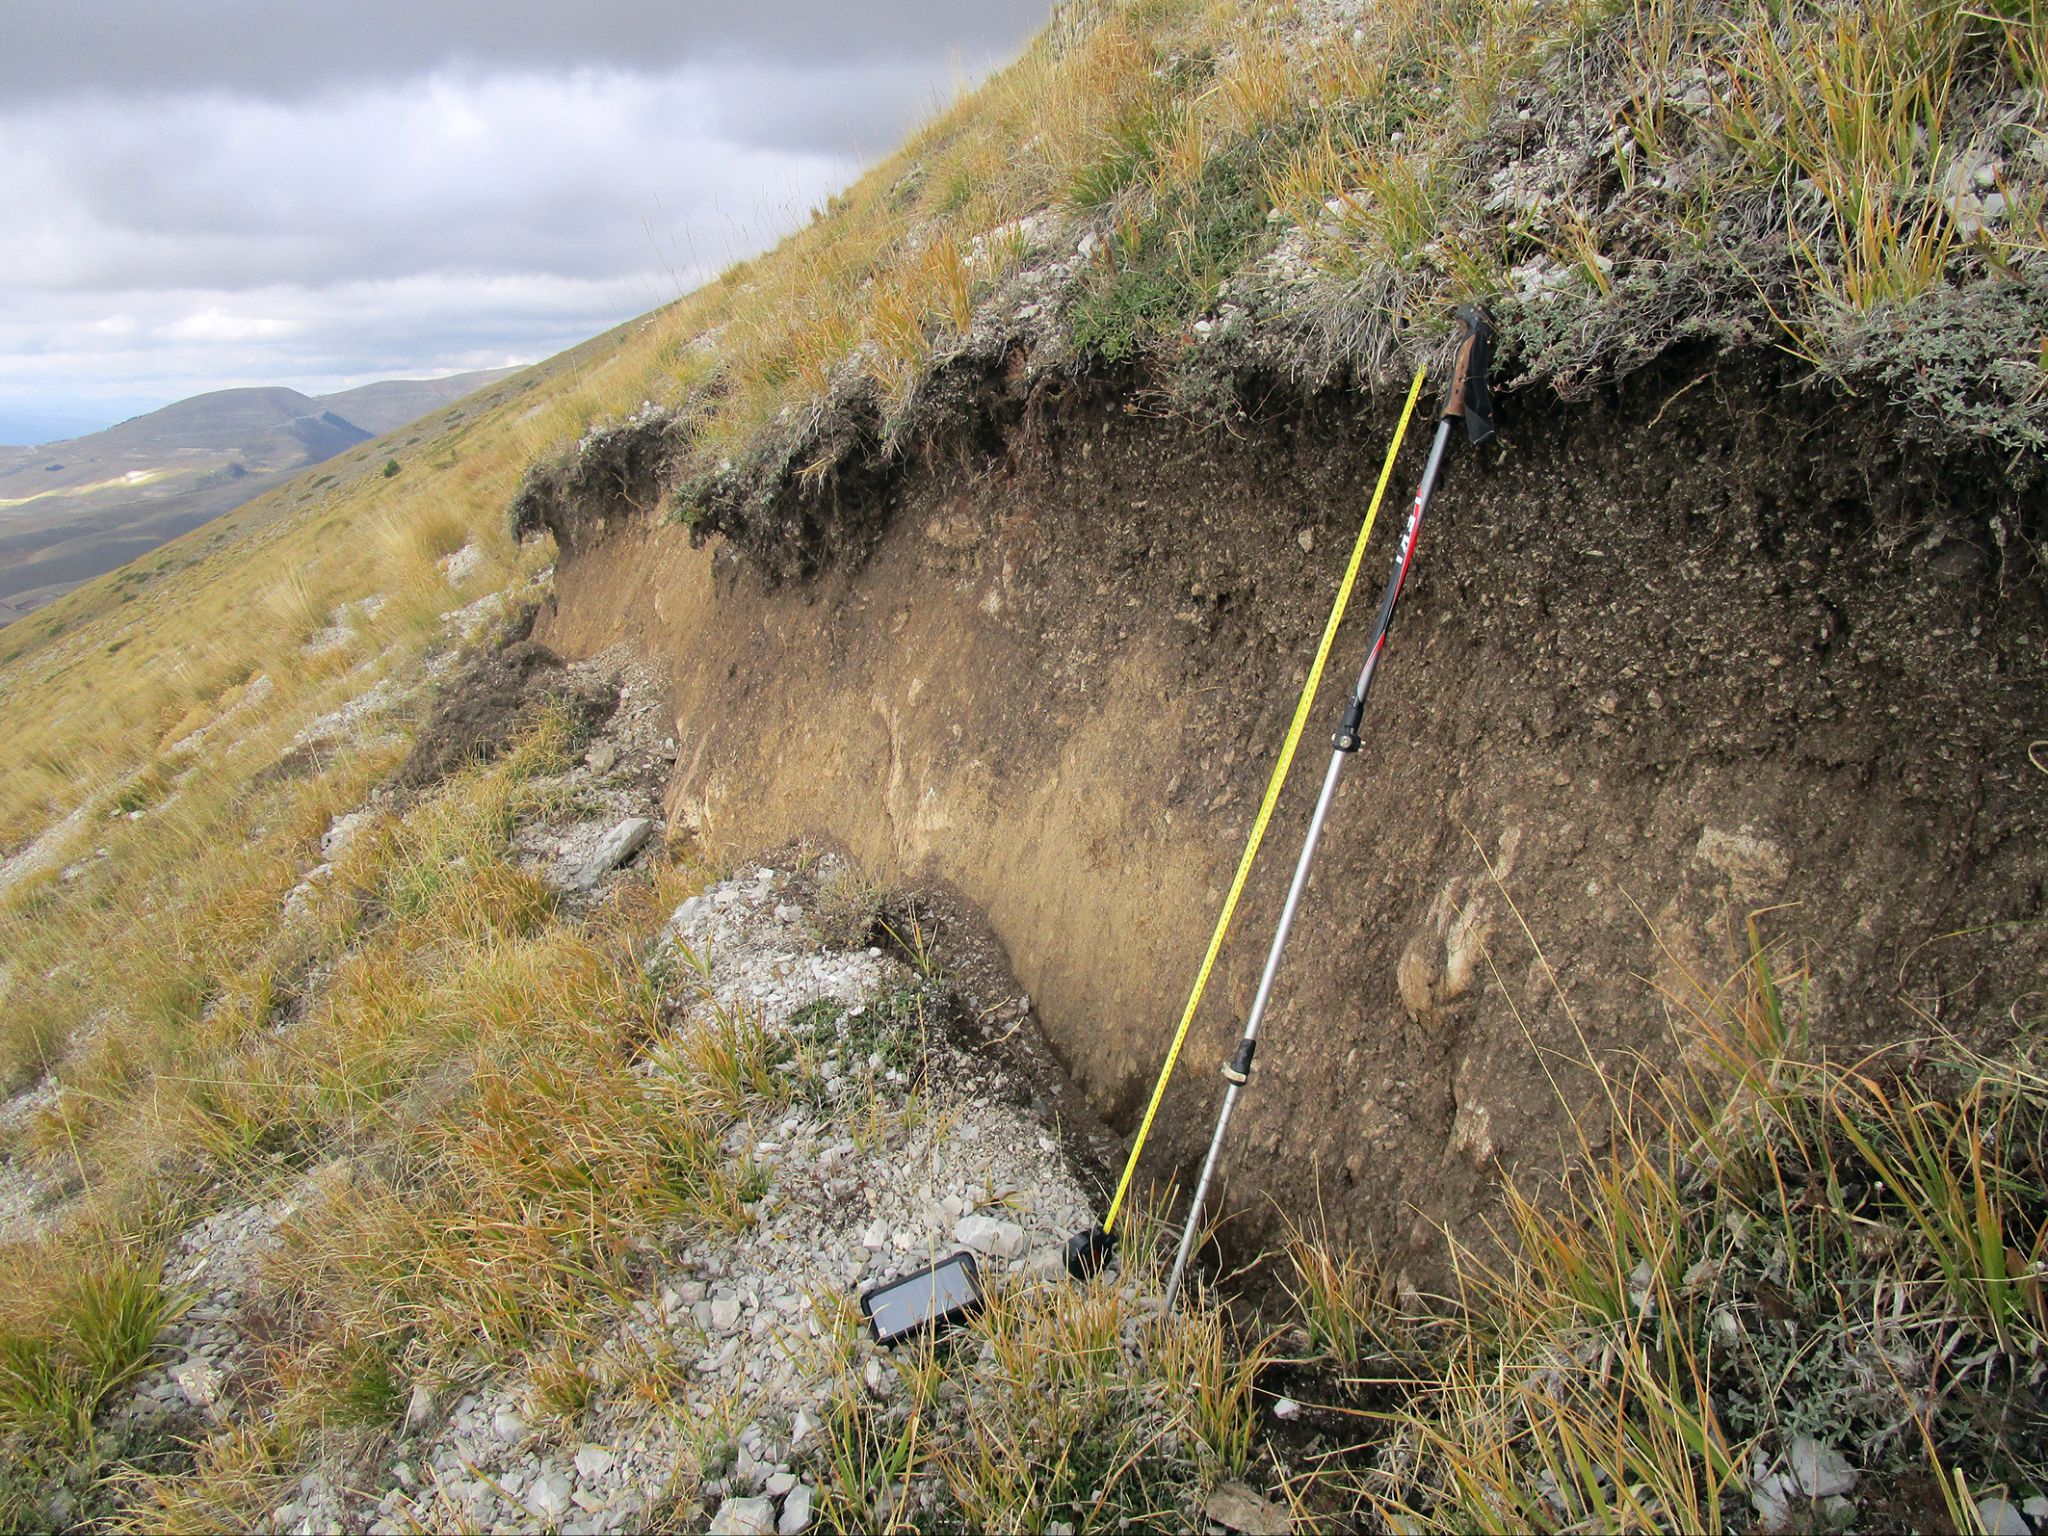
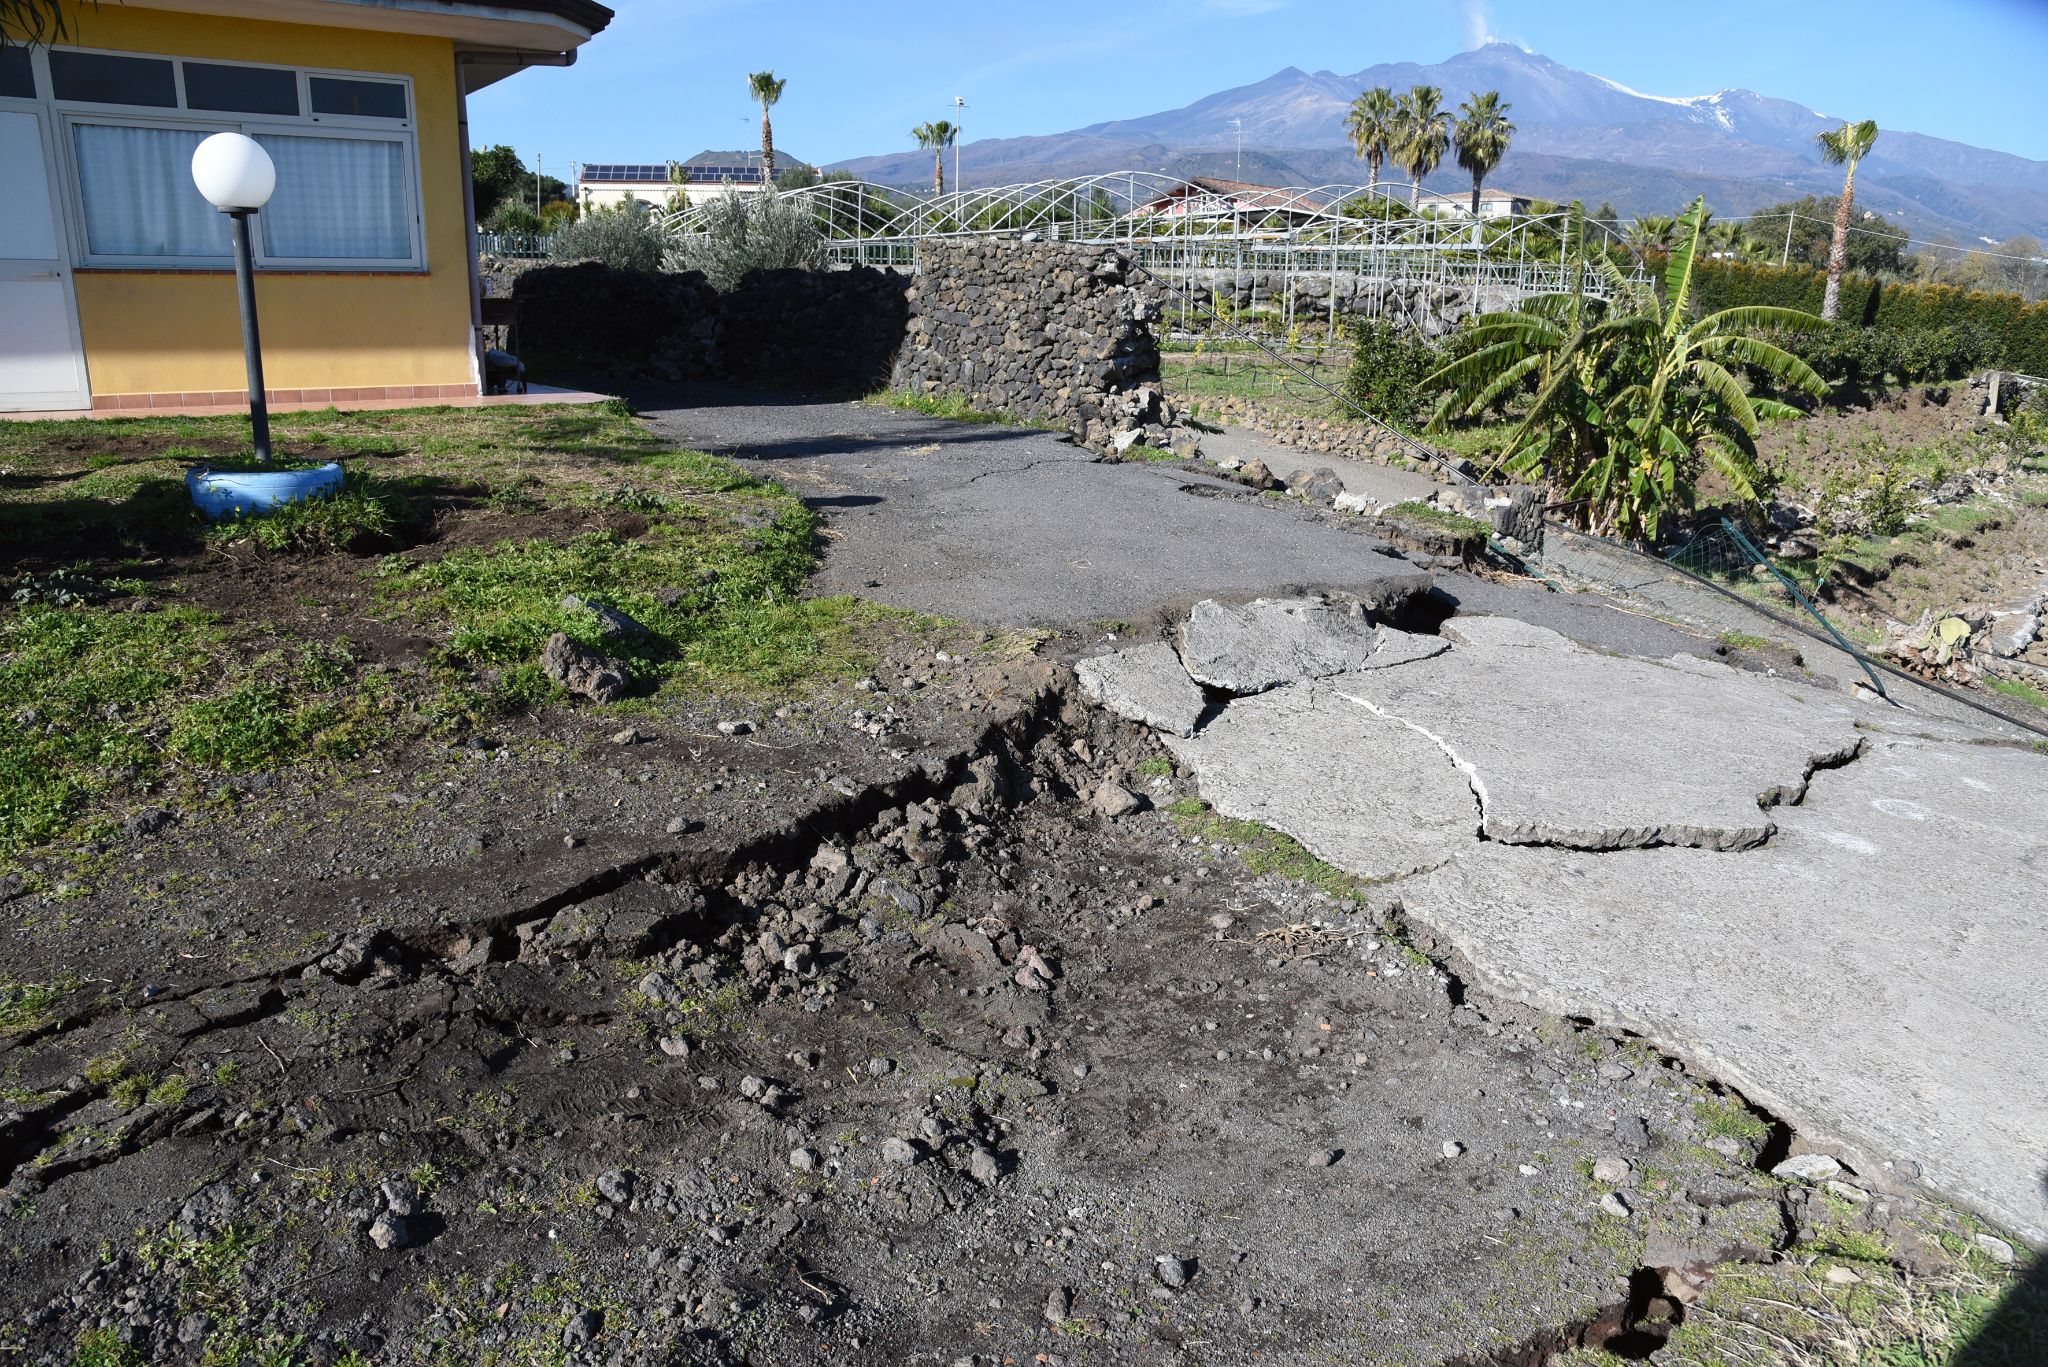
in the background. Credit: INGV.
- Details
- Category: datasets
PDF-Italy methodological approach
The Probability map of distributed faulting in Italy was obtained by combining information derived from two public databases: the DISS database (https://diss.ingv.it/), which is a geospatial repository of seismogenic sources, i.e. major active faults capable of generating damaging earthquakes and widely used in seismic hazard assessment, and the ITHACA database (https://sgi.isprambiente.it/ithacaweb/default.aspx#1) that collects available information on active and capable faults affecting the Italian territory, based on a critical review of the available literature.
In order to estimate the probability that a capable fault from the ITHACA database produces surface ruptures following earthquakes generated by the seismogenic sources of the DISS database, the elements of the two datasets are integrated into a system of principal and distributed faulting, a framework commonly adopted in coseismic surface faulting hazard studies. Specifically, the upper tip of the CSS seismogenic sources of DISS are treated as principal faults along which primary faulting occurs. Conversely, the capable faults from the ITHACA database are assimilated into distributed faulting phenomena that develop in association with primary faulting. The resulting probabilities are conditional probabilities of distributed faulting occurrence given the occurrence of an earthquake on the associated seismogenic source. They do not represent time-dependent probabilities and therefore should not be interpreted as the probability that fault rupture will occur within a specified time interval.
The selection of models for estimating the conditional probability of distributed faulting occurrence was guided by: (i) their compatibility with the methodological approach developed for the DISS–ITHACA interoperability; (ii) the updated status of the reference databases adopted; and (iii) the consistency of each model’s applicability range with the Italian seismotectonic setting. Consequently, for each kinematic style, the most recent model consistent with this framework was selected: for normal faults, we selected the model by Ferrario and Livio (2021), whereas for reverse and strike-slip faults, the models by Takao et al. (2014) were adopted.
Ferrario, M. F., and Livio, F. (2021). Conditional probability of distributed surface rupturing during normal‐faulting earthquakes. Solid Earth, 12(5), 1197–1209. https://doi.org/10.5194/se-12-1197-2021.
Takao, M., Ueta, K., Annaka, T., Kurita, T., Nakase, H., Kyoya, T., & Kato, J. (2014). Reliability improvement of probabilistic fault displacement hazard analysis. Journal of Japan Association for Earthquake Engineering, 14(2), 2‐16–2‐36. https://doi.org/10.5610/jaee.14.2_16.
PDF-Italy attributes description
Definition of the PDF-Italy1.0:zone_tszNNN table attributes. These attributes are the same in the distributed file and WFS service.
|
Field |
Variable |
Unit |
Description |
|
PDF-IT_ID |
Integer |
n.a. |
Identifier of the polygon. |
|
Lat_WGS84 |
Float |
Degrees |
Latitude of the center of the polygon. |
|
Lon_WGS84 |
Float |
Degrees |
Longitude of the center of the polygon. |
|
DISS_ID |
String |
n.a. |
Identifier of the CSS vertex that is the primary contributor of the conditional probability for that polygon. |
|
Distance |
Float |
Km |
Distance in kilometers to the specific CSS vertex that is the primary contributor of the conditional probability for that polygon. |
|
n_contrib |
Integer |
n.a. |
Total number of the CSS vertices contributing to the aggregated conditional probability of distributed faulting calculated on the center of the polygon. |
|
Ptot |
Float |
n.a. |
Aggregated conditional probability of distributed faulting calculated on the center of the polygon. |
|
Ptot_n |
Float |
n.a. |
Normalized total probability obtained dividing the total aggregated probability of distributed faulting by the number of contributing CSS vertices. |
Definition of the ITHACA_PDFtot table attributes. These attributes are the same in the distributed file and WFS service.
|
Field |
Variable |
Unit |
Description |
|
Vert_ID |
String |
n.a. |
Identifier of the ITHACA vertex. |
|
ITHACA_ID |
Integer |
n.a. |
Identifier of the ITHACA fault. |
|
Lat_WGS84 |
Float |
Degrees |
Latitude of the ITHACA vertex (EPSG:4326). |
|
Lon_WGS84 |
Float |
Degrees |
Longitude of the ITHACA vertex (EPSG:4326). |
|
DISS_ID |
String |
n.a. |
Identifier of the CSS source that is the primary contributor of the conditional probability for that ITHACA fault. |
|
Distance |
Float |
Km |
Distance in kilometers to the specific CSS vertex that is the primary contributor of the conditional probability for that ITHACA fault. |
|
n_contrib |
Integer |
n.a. |
Total number of the CSS vertices contributing to the aggregated conditional probability of distributed faulting calculated on the ITHACA fault vertex. |
|
Ptot |
Float |
n.a. |
Aggregated conditional probability of distributed faulting calculated on the ITHACA fault vertex. |
|
Ptot_n |
Float |
n.a. |
Normalized total probability obtained dividing the total aggregated probability of distributed faulting by the number of contributing CSS vertices. |
Definition of the Index-map table attributes. These attributes are the same in the distributed file and WFS service. CRS: EPSG 4326 - WGS84.
|
Field |
Variable |
Unit |
Description |
|
ZONE_ID |
String |
n.a. |
Identifier of the area. |
|
AREAKM2 |
Real |
km2 |
Surface of the area. |
|
Zone_WFS_URL |
String |
n.a. |
URL of the WFS layer |
- Details
- Category: datasets
The tables below summarize the content of the SF3D dataset. Table 1 lists the files available for download and as web services. Tables A1, A2, and A3 list the attribute definitions of each file.
Table 1 - Files distributed for download (GeoJSON) and via OGC WFS. The rightmost column indicates the relevant Table number with the attribute descriptions provided in tables A1-A3.
| File Name | Description | Parameters table link |
| SF3D1.0 - Master Table | Outline of the crustal fault meshes. Polygons. | A1 |
| SF3D1.0 - Meshes | Triangular elements of the fault mesh. Polygons. | A2 |
| SF3D1.0 - Points | Input data points used to construct the meshes. Points. | A3 |
Table A1 - SF3D1.0 Master Table - Polygon attributes.
| Field | Variable | Unit | Description |
| faultid | Char(254) | n.a. | Unique identifier of the fault within SF3D. |
| faultname | Char(254) | n.a. | Fault name. |
| t0json | Char(254) | n.a. | URL including a query to the webservice to download the SF3D fault points file of the relevant fault, in GeoJson format. |
| t2json | Char(254) | n.a. | URL including a query to the webservice to download the SF3D fault mesh file of the relevant fault, in GeoJson format. |
| t2type | Char(254) | n.a. | Interpolation method used to generate the mesh from the points. |
| lat_c | Float | degrees | Latitude of the polygon centroid, datum WGS84, positive North. |
| lon_c | Float | degrees | Longitude of the polygon centroid, datum WGS84, positive East. |
| depth_c | Float | m | Depth of the polygon centroid, datum mean sea level, positive up. |
| authorid | Char(254) | n.a. | Team identifier in the database. |
| notes | Char(254) | n.a. | Notes about the fault. |
Table A2 - SF3D1.0 - Points - Point attributes.
| Field | Variable | Unit | Description |
| faultId | Char(254) | n.a. | Fault unique identifier |
| pointId | Char(254) | n.a. | Fault point unique identifier |
| pointType | Char(254) | n.a. | Rich or Poor |
| extrusion | Char(254) | n.a. | Type of geometric extrusion |
| lat | Float | degrees | Fault point latitude, positive North |
| lon | Float | degrees | Fault point longitude, positive East |
| depth | Float | m | Fault point depth, positive up |
| dip | Float | degrees | Fault dip angle at the fault point |
| dipDir | Float | degrees | Fault dip direction at the fault point |
| extrudeUD | Float | m | Amount of updip geometric extrusion |
| extrudeDD | Float | m | Amount of downdip geometric extrusion |
| extrudeDx | Float | m | Amount of dextral geometric extrusion |
| extrudeSx | Float | m | Amount of sinistral geometric extrusion |
| nickname | Char(254) | n.a. | Fault or point “nickname.” |
| srcIdfs | Char(254) | n.a. | Fault unique identifier in an external database |
| notes | Char(254) | n.a. | Notes about the fault point |
Table A3 - SF3D1.0 - Meshes - Polygon attributes.
| Field | Variable | Unit | Description |
| faultId | Char(254) | n.a. | Identifier of the fault source within EFSM20. |
| IdTriangle | Integer | n.a. | Identifier of the mesh triangle. |
| IdVertex1 | Char(254) | n.a. | Identifier of the first triangle vertex. |
| lat1 | Float | degrees | Longitude of the first triangle vertex, datum WGS84, positive East. |
| lon1 | Float | degrees | Latitude of the first triangle vertex, datum WGS84, positive North. |
| depth1 | Float | m | Depth of the first triangle vertex, datum mean sea level, positive up. |
| IdVertex2 | Char(254) | n.a. | Identifier of the second triangle vertex. |
| lat2 | Float | degrees | Longitude of the second triangle vertex, datum WGS84, positive East. |
| lon2 | Float | degrees | Latitude of the second triangle vertex, datum WGS84, positive North. |
| depth2 | Float | m | Depth of the second triangle vertex, datum mean sea level, positive up. |
| IdVertex3 | Char(254) | n.a. | Identifier of the third triangle vertex. |
| lat3 | Float | degrees | Longitude of the third triangle vertex, datum WGS84, positive East. |
| lon3 | Float | degrees | Latitude of the third triangle vertex, datum WGS84, positive North. |
| depth3 | Float | m | Depth of the third triangle vertex, datum mean sea level, positive up. |
| lat_c | Float | degrees | Longitude of the triangle centroid, datum WGS84, positive East. |
| lon_c | Float | degrees | Latitude of the triangle centroid, datum WGS84, positive North. |
| depth_c | Float | m | Depth of the triangle centroid, datum mean sea level, positive up. |
| strike | Float | degrees | Value of the triangle orientation, between 0-360° increasing clockwise from the north following the right-hand rule. |
| dip | Float | degrees | Value of the triangle dip angle, between 0-90° increasing downward from the horizontal. |
| area | Float | m^2 | Area of the triangle. |
| AR | Float | scalar | Aspect ratio of the triangle, calculated as the ratio of the largest and shortest distance between the centroid and the vertices. |
| R | Float | scalar | Ratio between area and aspect ratio. |